m0nitor
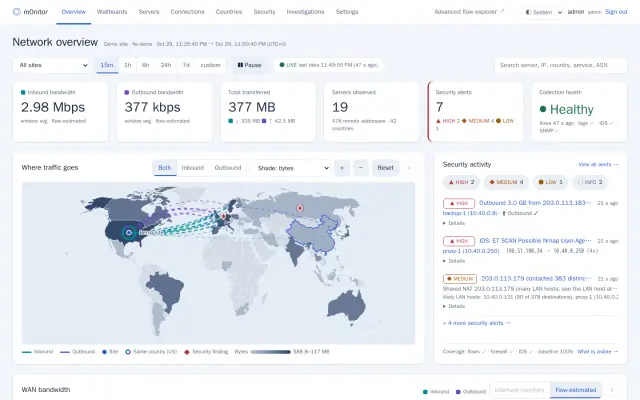
Self-hosted network and firewall monitoring for OPNsense: bandwidth per server, a world map of where traffic goes, blocked traffic by country, and security findings that each carry their evidence.
The problem
Firewalls see every connection, but their logs and graphs rarely answer the simple questions: where is our traffic going, what did the firewall block, and is anything on the network behaving unusually?
Why existing tools fell short
Firewall dashboards show live counters and raw log lines; flow tools show volumes without context. Neither says why something deserves attention, and neither admits what it cannot see.
The solution
The firewall only sends telemetry — NetFlow v9, remote syslog, and optionally SNMP — so m0nitor never sits in the forwarding path: if it stops, traffic is unaffected. It turns that telemetry into per-server bandwidth, a world map of traffic, blocked traffic by country, and findings that show their working.
- Bandwidth and connections per server, by country and organization
- A world map of traffic directions, plus wallboards
- Blocked traffic and the live GeoIP policy, by country
- Explainable security findings with evidence, baseline, and next steps
- Light and dark themes; never in the traffic path
Engineering involved
Verified from the public repository: README, docs, and source tree.
- Backend
- Python FastAPI application in Docker, with its own data in SQLite.
- Flow storage
- Akvorado with ClickHouse stores the flows and provides the advanced flow explorer.
- Front end
- Server-rendered pages with plain JavaScript; the world map is drawn with D3. Light and dark themes, and a layout that works on a phone.
- Collection
- NetFlow v9 and remote syslog from OPNsense (firewall log, Suricata alerts, configuration and authentication events), optional SNMP, and an optional Zeek sensor on a mirror port.
- Detection
- Explainable rules — new destination country or network, unexpected inbound, outbound volume, fan-out and port scans, beaconing, IDS alerts, DNS anomalies — each with its evidence, query, and baseline.
- Operations
- Caddy TLS front end, a root-side helper that renders per-firewall ACLs, and an encrypted daily backup.
What makes it interesting
Traffic behind a shared outbound NAT address is attributed to LAN hosts from the return path, with an explicit confidence level — and a Coverage page says which telemetry is actually arriving, so missing evidence is shown as missing rather than as safe.
Outcome
Not measured m0nitor is a pre-release with no published release yet. No installation or usage figures exist, so none are claimed here.
Current status
Open Source · Pre-release Free, MIT-licensed, self-hosted. The source code is public on GitHub; there is no published release or installer yet.
Open source under the MIT license; bundled Akvorado configuration files keep their AGPL-3.0 license. Until the first release, installation follows the documented manual steps. Built for OPNsense; pfSense works with limits.
See it working
Screenshots from the isolated demo (synthetic data only) and the install guide: github.com/agit8or1/m0nitor. Overview: mspzero.com/tools/m0nitor.
Need something similar built for your business?
These projects demonstrate the kinds of systems I design and develop. Your application would be built around your own workflows, integrations, requirements, and budget.